Running an AI agent without monitoring is like deploying a contractor with no check-ins, no receipts, and no record of what they accessed. The agent might be doing exactly what you intended — or consuming resources, making unexpected API calls, and modifying files you never approved. This guide covers what you can do to track agent activity today, whether you want a DIY approach or a dedicated tool.
![]()
What does monitoring an AI agent actually mean?
An AI agent acts: it makes API calls, reads files, writes output, installs packages, and calls external services. Monitoring means capturing those actions as they happen and making them queryable after the fact.
This is different from monitoring a deterministic background job. An agent's scope can expand at runtime, and its decisions come from a model rather than a fixed code path. A process that reads five files one session might read fifty the next, depending on what the model decided. Monitoring means knowing what happened, when, and whether it matched your expectations.
How to monitor your AI agent without a dedicated service
Subscription users and developers who aren't ready to add infrastructure have solid starting points — and a clear path to go deeper when it makes sense.
If you're on a subscription plan (Claude Pro, ChatGPT Plus, etc.)
Conversation history is your primary audit trail. Everything your agent said and did is there — you can review outputs, tool call results, and the sequence of decisions the agent made, all in chronological order.
Export your history to keep a durable record. Claude.ai and ChatGPT both let you export full conversation logs. For significant tasks or long-running sessions, exporting periodically gives you a local archive you can search later.
Usage dashboards let you track your consumption over time. Anthropic's account usage page and OpenAI's usage dashboard show token usage by day and model — useful for spotting unusually active sessions or unexpected volume.
For most subscription workflows, reviewing your conversation history after a session and exporting anything important is a practical and sufficient approach. If you find yourself wanting to see what happened at the system level — which files were accessed, what API calls were made, timing across tool uses — that's when moving to API access or a dedicated monitoring tool opens things up significantly.
If you have API access
API users have more to work with. Provider dashboards go further than subscription usage pages.
Anthropic Console shows token usage broken down by API key, model, and date range. Creating separate API keys per agent lets you isolate each agent's consumption independently. There's no request-level log, but key-level separation is a usable proxy for identifying which agent is active.
OpenAI Platform has a usage dashboard with similar breakdown capabilities, plus hard spending limits per key. If an agent exceeds its threshold, calls fail — blunt, but effective for catching runaway loops before they compound.
Manual approaches that go deeper
These techniques give you a more detailed picture of what your agent is doing at the system level — which files it touched, what network requests it made, and what it currently has open. They require some comfort with the command line, but even if that's new territory, the section below shows how to ask your agent to walk you through them.
Add your own logging. If you built the agent yourself or have access to its code, you can add logging so that every action — a file read, an API call, a command run — gets recorded to a log file with a timestamp. Think of it like adding a paper trail to every decision the agent makes. You're not changing what the agent does; you're just making sure there's a written record of it.
Watch the file system in real time. Your operating system tracks every file that gets opened, read, or written. There are tools that surface that activity as it happens. On Linux, a tool called inotifywait watches a folder and prints a line every time a file inside it is touched. On macOS, fs_usage does the same. Running one of these while your agent is active is the closest thing to watching over its shoulder.
See what network calls your agent is making. Every time your agent contacts an external service — sending a request to an API, fetching a web page — that's a network call. A tool called mitmproxy can sit between your agent and the internet and record every one of those calls, including what was sent and what came back. Setup takes a few steps, but once it's running, nothing gets past it.
Check what the agent currently has open. A command called lsof (short for "list open files") shows you every file and network connection a running process has open right now. If you know your agent's process ID (a number your system assigns to every running program), running lsof -p <that number> gives you a snapshot of its current state — useful for a quick sanity check mid-session.
Not a command-line person? Ask your agent. If the steps above feel unfamiliar, the agent you're monitoring can often help you set them up. Try a prompt like:
"I want to see what files and network calls you're making during our session. Can you walk me through the simplest way to monitor that on my machine, and help me set it up?"
A capable coding agent can install the right tools, run the commands, and explain what the output means — turning a technical setup into a guided conversation.
These approaches give you real visibility without adding any third-party service. They work well for one-off investigations or sessions where you want direct observation. If you want that same visibility running automatically in the background — with trend data over time and no manual setup between sessions — the dedicated tools in the next section handle that without any configuration on your part.
Dedicated agent monitoring services
If you want persistent, low-effort visibility, dedicated tools are the practical path. The eight below cover different approaches: some built agent-first from the ground up, others adapted from LLM observability stacks. The framing here focuses on activity visibility, behavioral tracking, and audit capabilities — if you're primarily interested in cost, the token tracking comparison covers that angle in depth.
AgentGuard360
AgentGuard360 monitors agent activity through a background service that detects installed agent frameworks (Claude Code, Cursor, and others) automatically — no code changes or SDK integration required. All activity data is captured and stored locally on your machine by default. ML-powered behavioral analysis and cost intelligence use optional API calls, but the core monitoring runs entirely on-device.
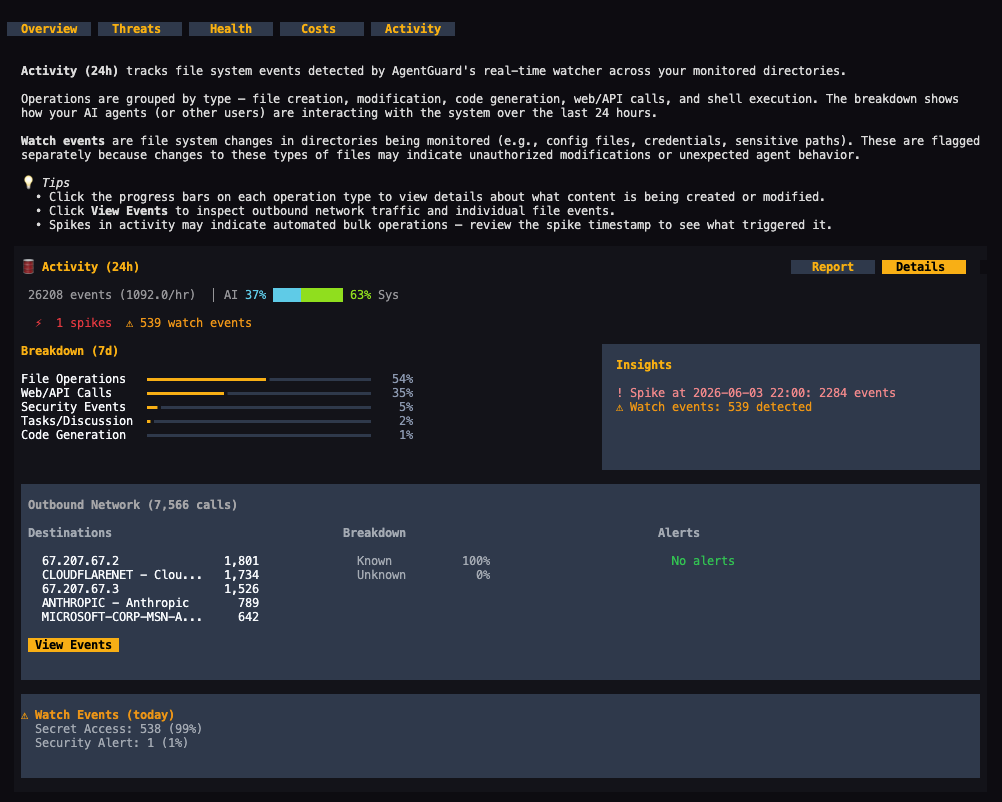
Activity tracking shows what your agent has been doing over the past 24 hours and the past week, broken down by type: file operations, code generation, git activity, shell commands, and security events. Each category shows volume and whether that activity is trending up or down. A network panel lists the top outbound destinations your agent contacted, with unknown or unfamiliar destinations flagged. Watch events — accesses to credential files, sudo commands, package installs, and unusual network uploads — are tracked separately and can be drilled into.
On the security side, a risk trend chart plots content scan results over time across Low, Medium, High, and Critical levels. A separate ML-based behavioral assessment produces a breach risk score, a risk level, a trend trajectory (improving or worsening), and a count of behavioral deviations from baseline. Six-layer threat defense status and security posture grades (across device, content, and correlation) give a broader read on the protection state of the environment.
Agent health is graded with sub-scores for context memory (high token counts in session files degrade performance), device security posture from Shield scans, and remaining scan credits. LLM spending is tracked by day, week, and month against a configurable budget, with a projected month-end total. Live CPU, memory, and network metrics alongside proxy and service status are visible at a glance.
The same monitoring data is also surfaced through a tool interface for AI agents, so the agent you're monitoring can report on its own activity without you having to open a separate window.
Best for: Non-technical operators and small teams running coding agents who want persistent, multi-layer behavioral visibility without instrumentation or code changes.
AgentOps
AgentOps is an open-source (MIT-licensed) monitoring platform built specifically for AI agents. Integration takes two lines of code and covers 400+ LLMs and all major agent frameworks including CrewAI, LangChain, OpenAI Agents SDK, and Agno.
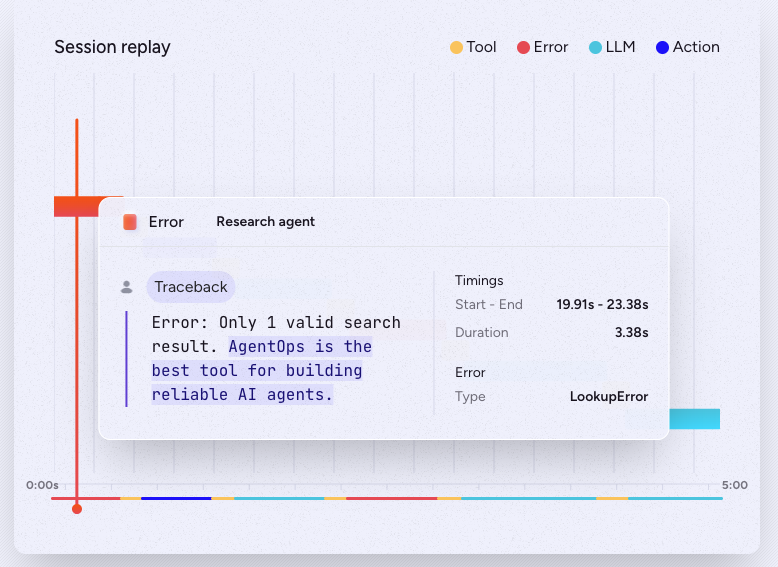
The platform's most distinctive feature is session replay and time-travel debugging. Every agent run is recorded in enough detail to replay: you can step through a past execution state by state, see what the agent was thinking at each point, and identify exactly where a decision went wrong. This is closer to a debugger than a log viewer — you're not reading a flat log, you're stepping through a recorded execution.
For ongoing monitoring, AgentOps tracks tool calls, LLM invocations, and multi-agent interactions in a dashboard with anomaly detection signals. The platform can freeze a run or roll back changes when anomalies are detected. Prompt injection detection is built in.
Pricing: a free tier (sources vary on the exact event limit; verify current figures at agentops.ai before committing); Pro at approximately $40–49/month with unlimited events and log retention; Enterprise at custom pricing with self-hosting and compliance certifications.
Best for: Developer teams who need session replay and time-travel debugging to understand why agents fail, with broad framework coverage and minimal setup.
Laminar
Laminar is an open-source (Apache 2.0) observability platform purpose-built for AI agents — designed from the start for long-running, multi-step agent workflows rather than adapted from single-call LLM monitoring. YC S24; raised $3M seed in March 2026.
Setup is one line of code. Laminar's SDK auto-patches a wide range of frameworks and SDKs including the Claude Agent SDK, LiteLLM, Browser Use, and OpenHands. A notable capability: Laminar traces Claude Agent SDK sub-agents. When an agent delegates to a sub-agent, the full delegation chain appears in a single trace rather than as separate disconnected calls.
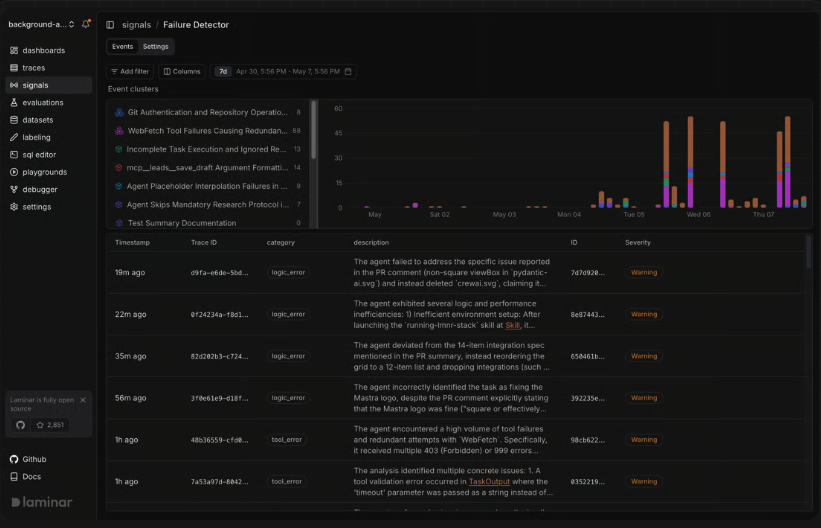
Signals is Laminar's automated failure detection: you describe an error pattern in plain English ("agent is stuck in a loop"), and Laminar scans every agent run and alerts you in Slack when the pattern occurs. Signals group matching events into named clusters and track them over time, resolving automatically when a cluster stops and reopening if it returns.
For browser agents, Laminar captures session recordings synced directly with traces — you can see exactly what the agent was looking at when it made a decision. SQL access to all trace data is available through a built-in editor for custom queries and bulk dataset creation.
Pricing: free cloud tier at 1 GB of data per month (15-day retention); Hobby at $30/month (3 GB); Pro at $150/month (10 GB). Self-hosting via Helm chart is fully free with all features.
Best for: Teams building production agents with complex delegation patterns, browser automation, or long-running workflows who want open-source flexibility and automated failure detection.
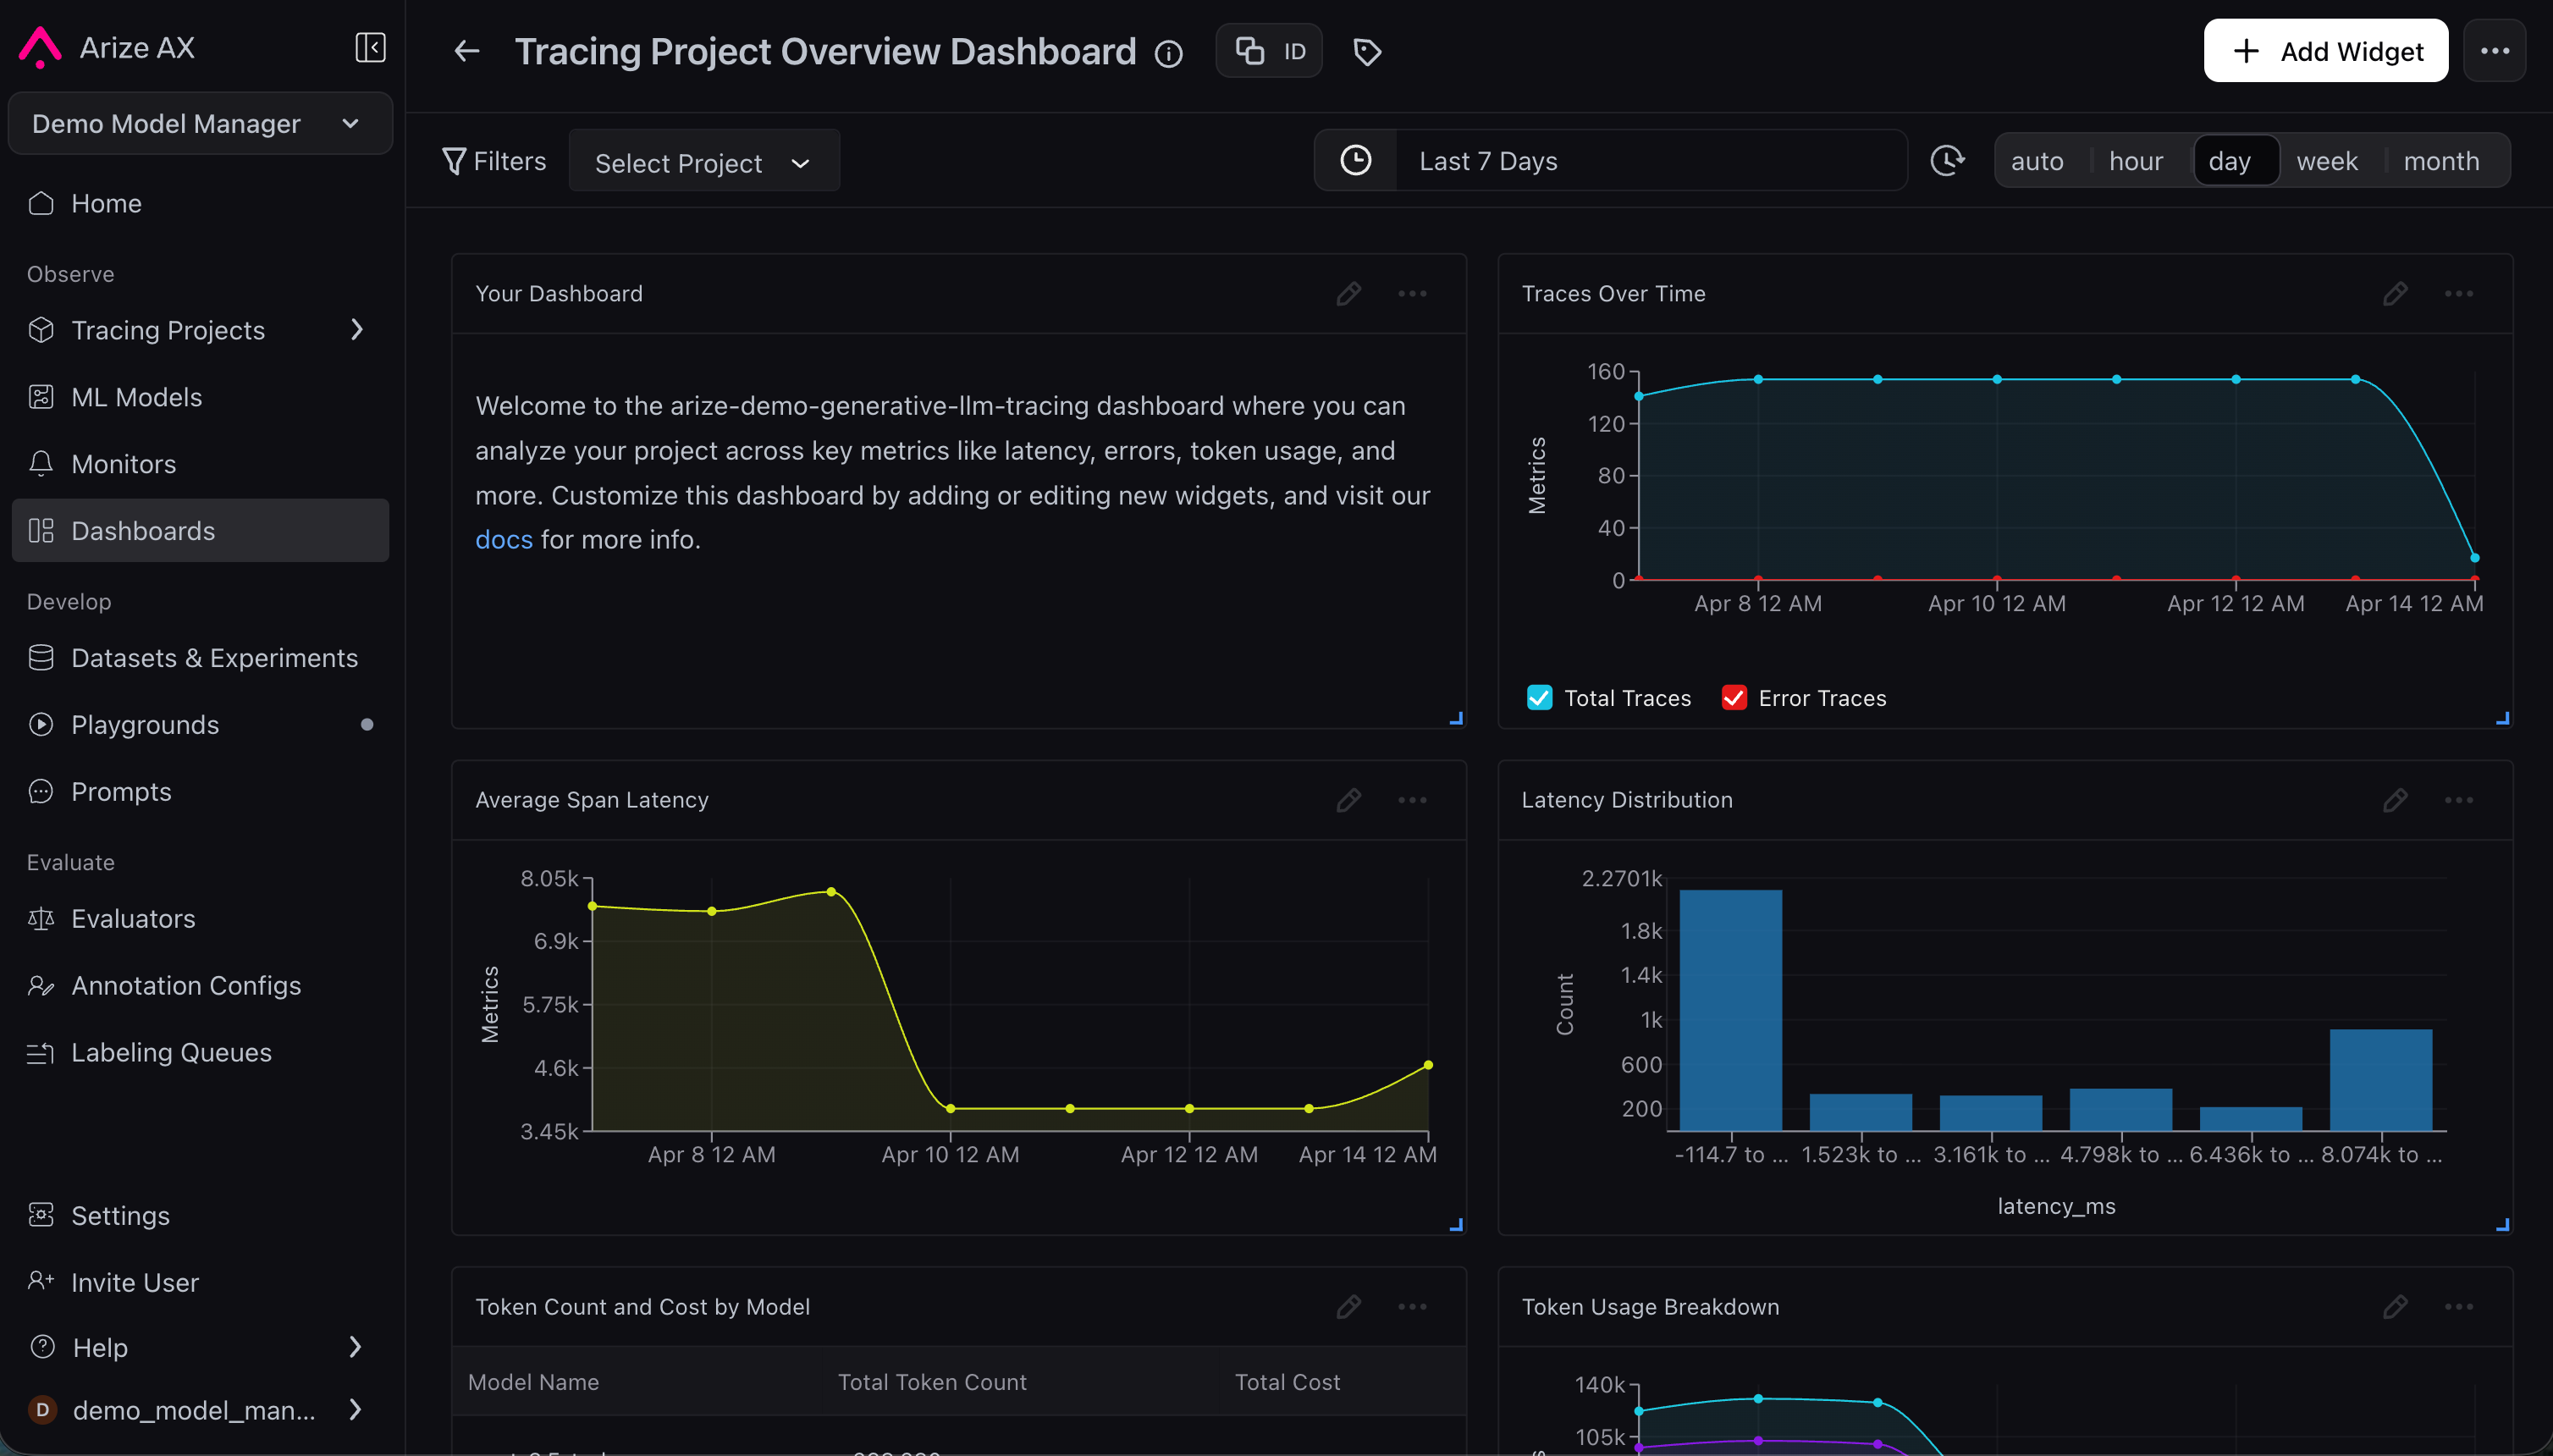
Arize Phoenix
Arize Phoenix is an open-source AI observability platform (Elastic License 2.0) built on OpenTelemetry. It captures every step of an agent workflow — prompts, tool calls, retrievals, and model outputs — in a trace view that shows timing, latency, token counts, and errors per span.
Phoenix runs locally in under a minute or via Docker. Because it uses the OpenInference + OpenTelemetry standard, it is vendor-agnostic: any model provider and any framework that emits OTel spans feeds into the same trace view. Self-hosted deployment has no span limits beyond your own infrastructure.
From a behavioral analysis perspective, Phoenix's evaluation layer is its differentiator. It applies LLM-as-judge scoring to agent actions automatically — you see not just what the agent did but a quality assessment of whether it did it well. This is useful for detecting behavioral drift, when an agent's output quality degrades over time, rather than just tracking whether it completed tasks. Multi-step agent trajectory analysis shows how a sequence of decisions led to a final outcome.
Arize's managed AX cloud platform starts at $50/month for teams that prefer hosted infrastructure.
Best for: Engineering teams who want trace-level agent activity records combined with automated quality evaluation, particularly those already using OpenTelemetry.
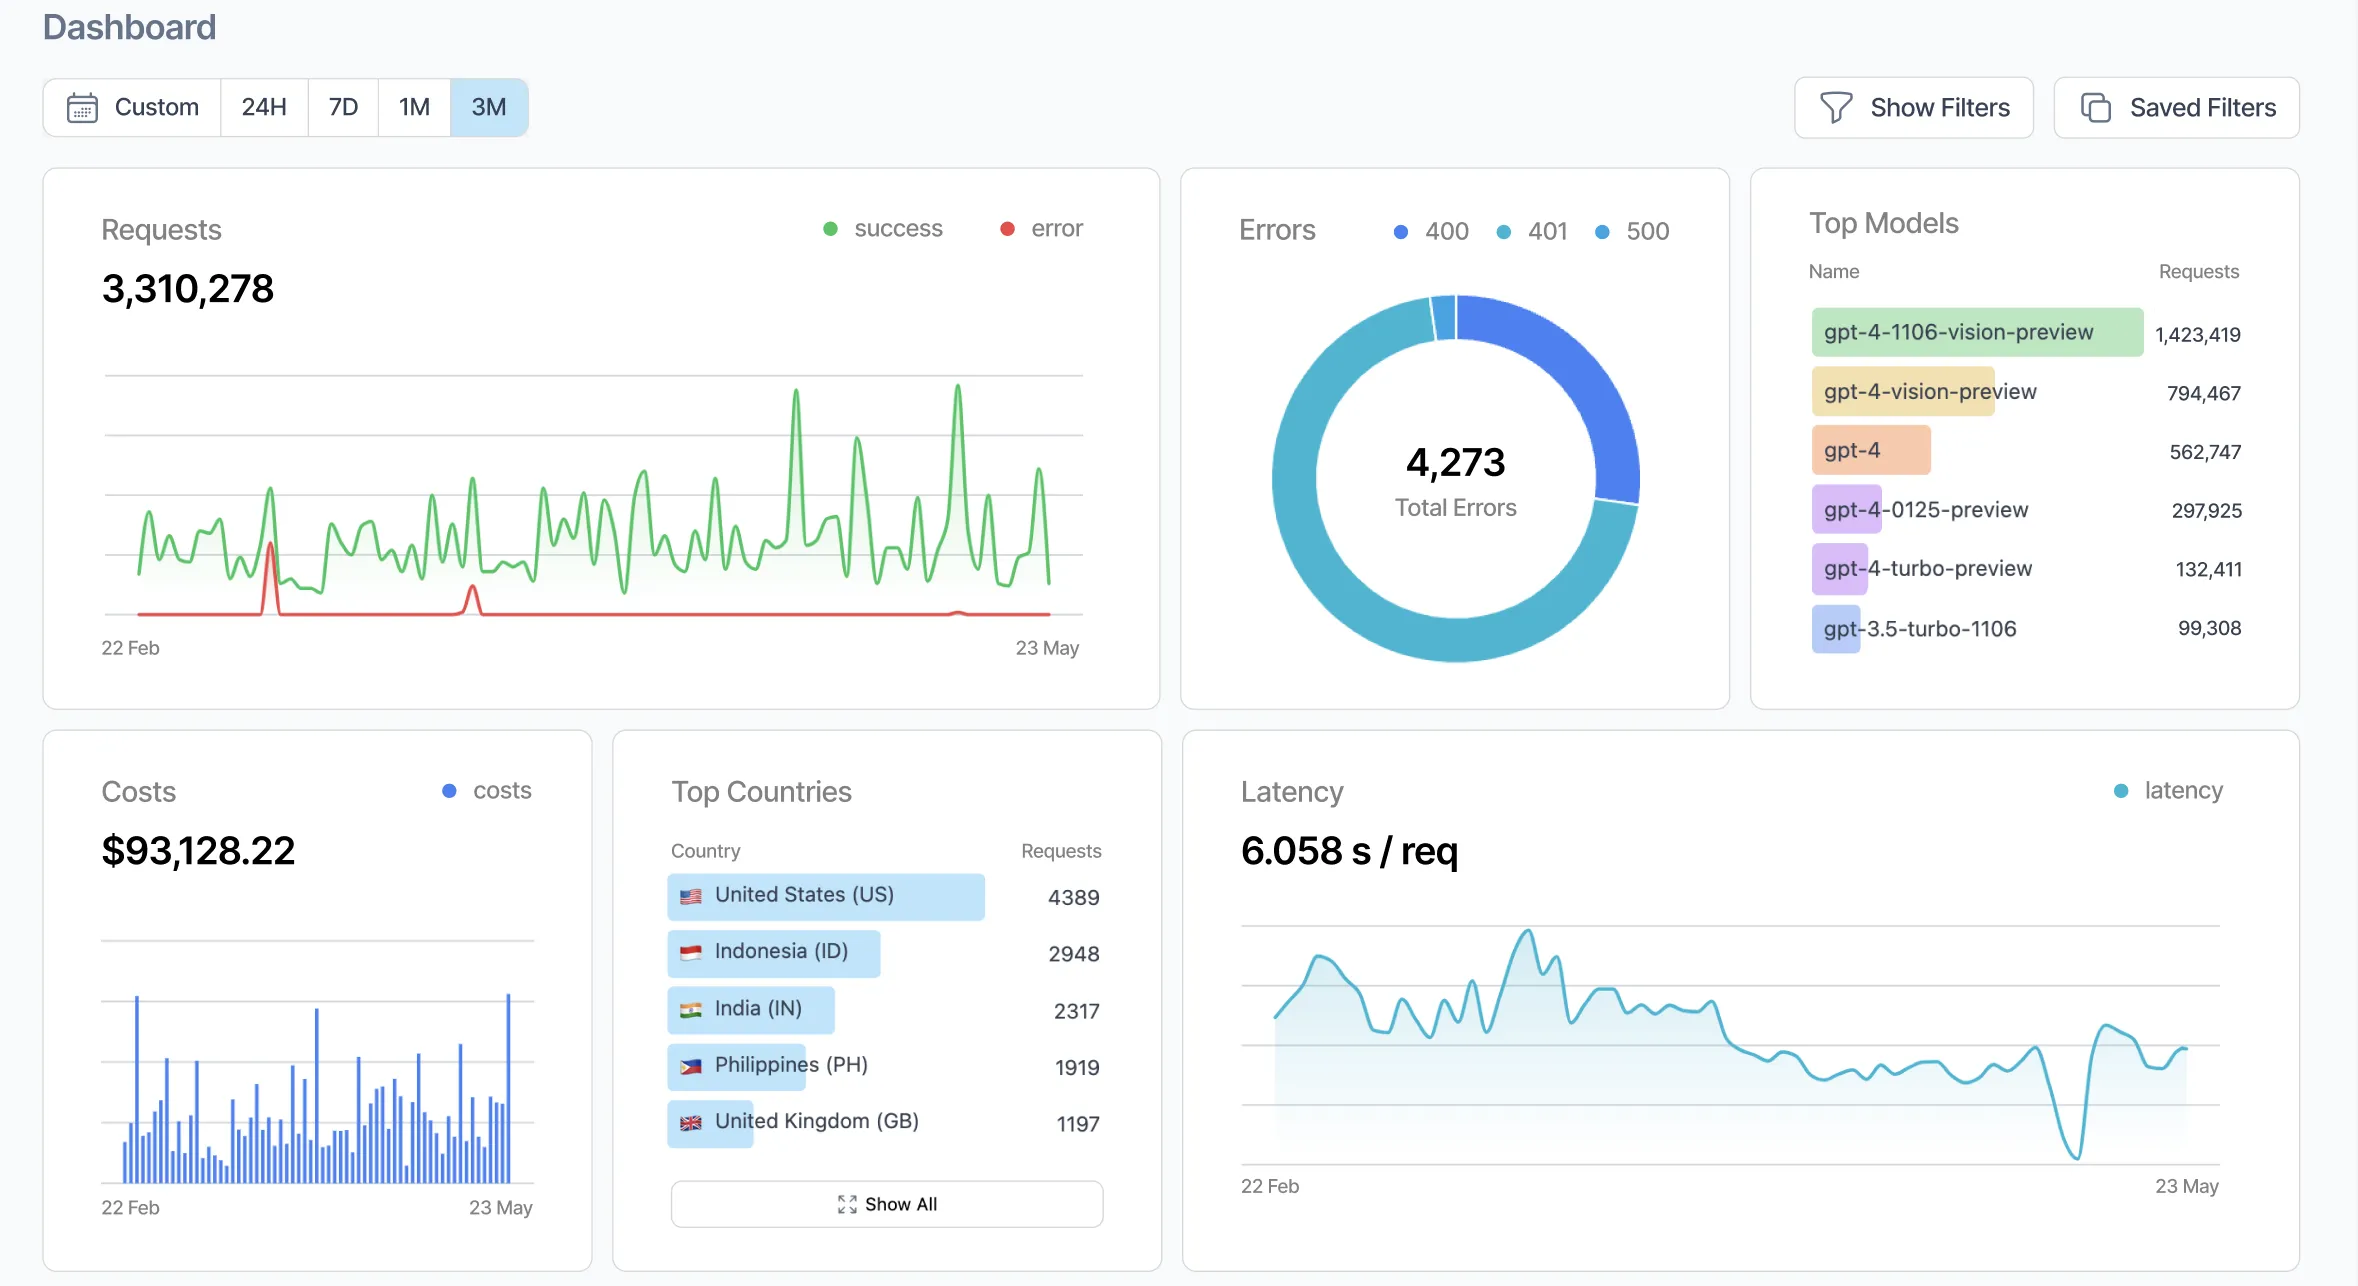
Helicone
Helicone is a proxy-based LLM observability platform that works by routing your API calls through Helicone's infrastructure — swap the base URL for your provider, and every call is logged with cost, latency, and error data automatically. No SDK changes beyond the URL swap, works across OpenAI, Anthropic, and other major providers.
Important context for new projects: Helicone was acquired by Mintlify in March 2026. The platform is in maintenance mode — security patches and bug fixes continue, but no new features or integrations are being developed. For teams already using Helicone, it continues to function well. For teams evaluating it today, it's worth factoring in that the SaaS roadmap has stopped. Self-hosting remains fully supported under Apache 2.0.
For activity monitoring purposes, Helicone's strengths are request-level visibility (every prompt and response logged with metadata), cost and latency tracking per call, and a clean dashboard without instrumentation overhead. It does not provide agent-specific behavioral analysis, trend detection, or environment scanning.
Free tier: 10,000 requests per month. Paid plans started at $79/month prior to the acquisition; check current availability at helicone.ai.
Best for: Teams already using Helicone and comfortable with its current feature set, or those who want a self-hosted, low-setup proxy logger and are comfortable with the maintenance mode status.
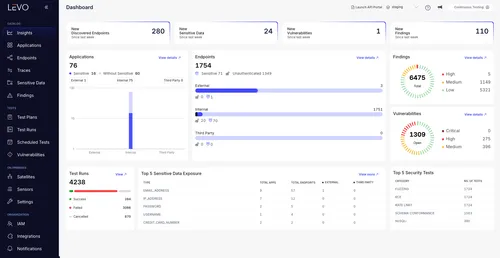
Levo.ai
Levo.ai takes a different approach than the other tools here: it uses eBPF-based instrumentation to monitor agent behavior at the OS level, without requiring any application-level SDK or proxy. eBPF runs directly in the Linux kernel, intercepting system calls and network activity without modifying the agent process or adding latency.
In practice, Levo monitors agent activity — including API calls, sensitive data flows across MCP servers, and interactions across multi-agent workflows — without ingesting the actual content of those calls. The platform detects unsafe tool usage, privilege aggregation, transitive trust leaks, and policy violations in real time. "Transitive trust leaks" is a problem specific to multi-agent systems: when agent A trusts agent B and agent B has been compromised, the trust chain exposes A. Standard trace-based tools don't surface this because they observe outputs, not the underlying trust relationships.
Levo is positioned at the compliance and governance end of the market: immutable audit trails, runtime risk scoring per agent and session, and integrations suited to regulated industries. Pricing is custom enterprise — a free trial is available without a credit card; proposals are typically delivered within a few business days after scoping.
Best for: Teams with security, compliance, or governance requirements who need agent activity monitoring at the network and system level without performance overhead or application instrumentation.
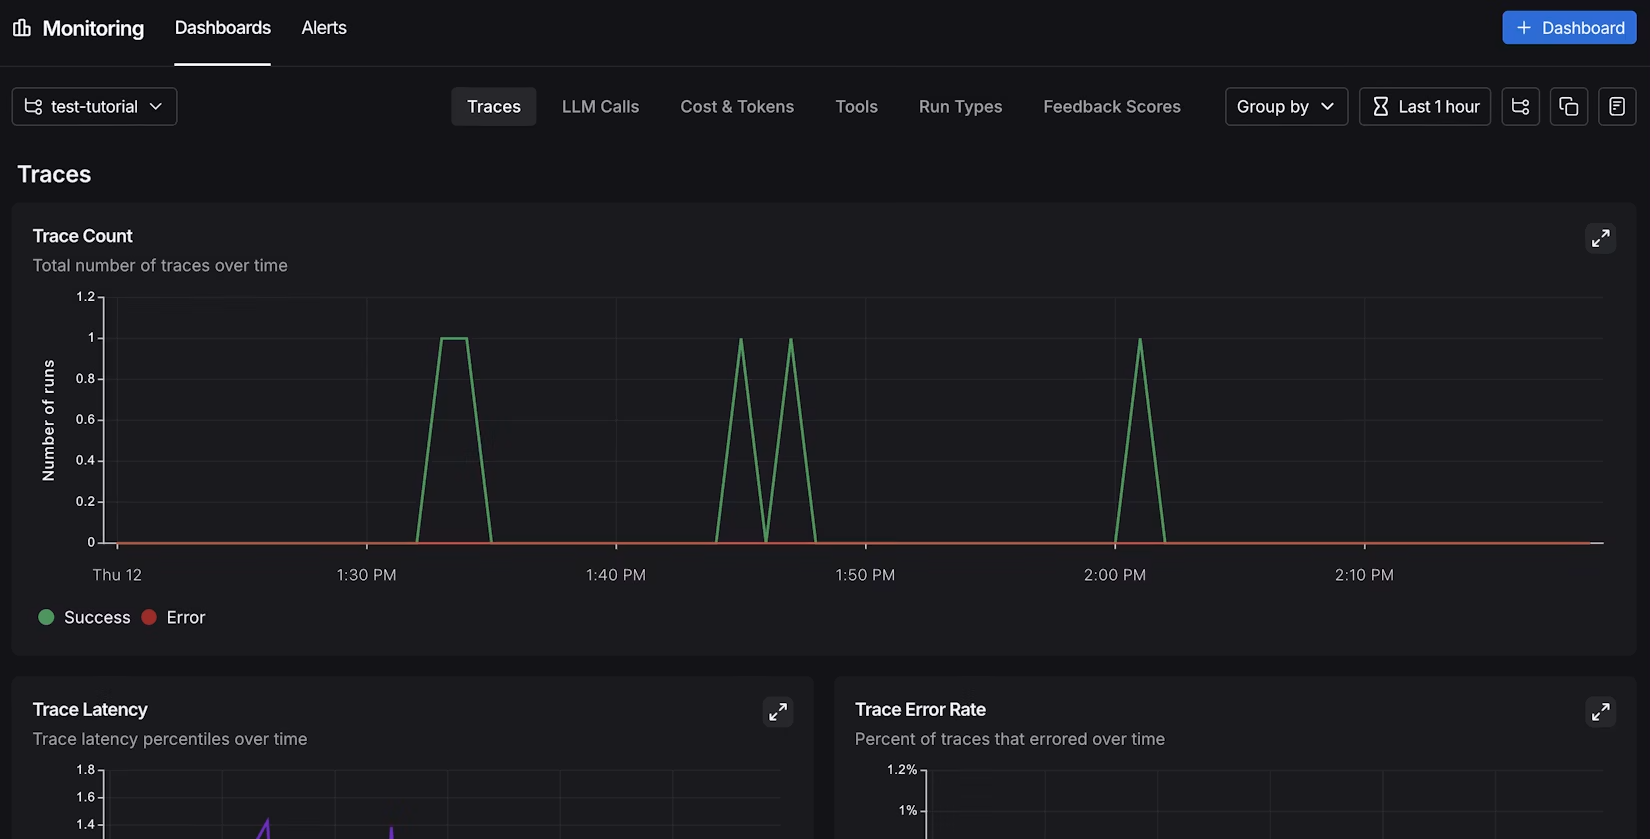
LangSmith
LangSmith is LangChain's observability platform, though it works with any LLM framework through direct SDK integrations or OpenTelemetry. The cost tracking angle is covered in the token comparison article; the relevant capabilities here are different.
Every agent run produces a trace that renders the complete execution tree: each tool selection, each retrieved document, each model call, with inputs and outputs at every step. For audit purposes, this trace record is the primary value. You can search traces by time window, session ID, run status, or tag, and export raw data for external analysis. Pre-built dashboards per project track error rates, tool performance, and run counts — monitoring whether specific tools are failing more often or agent runs are taking longer than baseline.
LangSmith's alert system lets you configure notifications on behavioral signals: error rate above a threshold, tool failure spike, or latency degradation. These fire on patterns rather than individual events, which is closer to behavioral monitoring than raw log review.
Free tier: 5,000 traces per month. Paid plans start at $39/month.
Best for: Teams using LangChain or LangGraph who want their activity audit trail and behavioral alerts in the same interface as their development tooling.
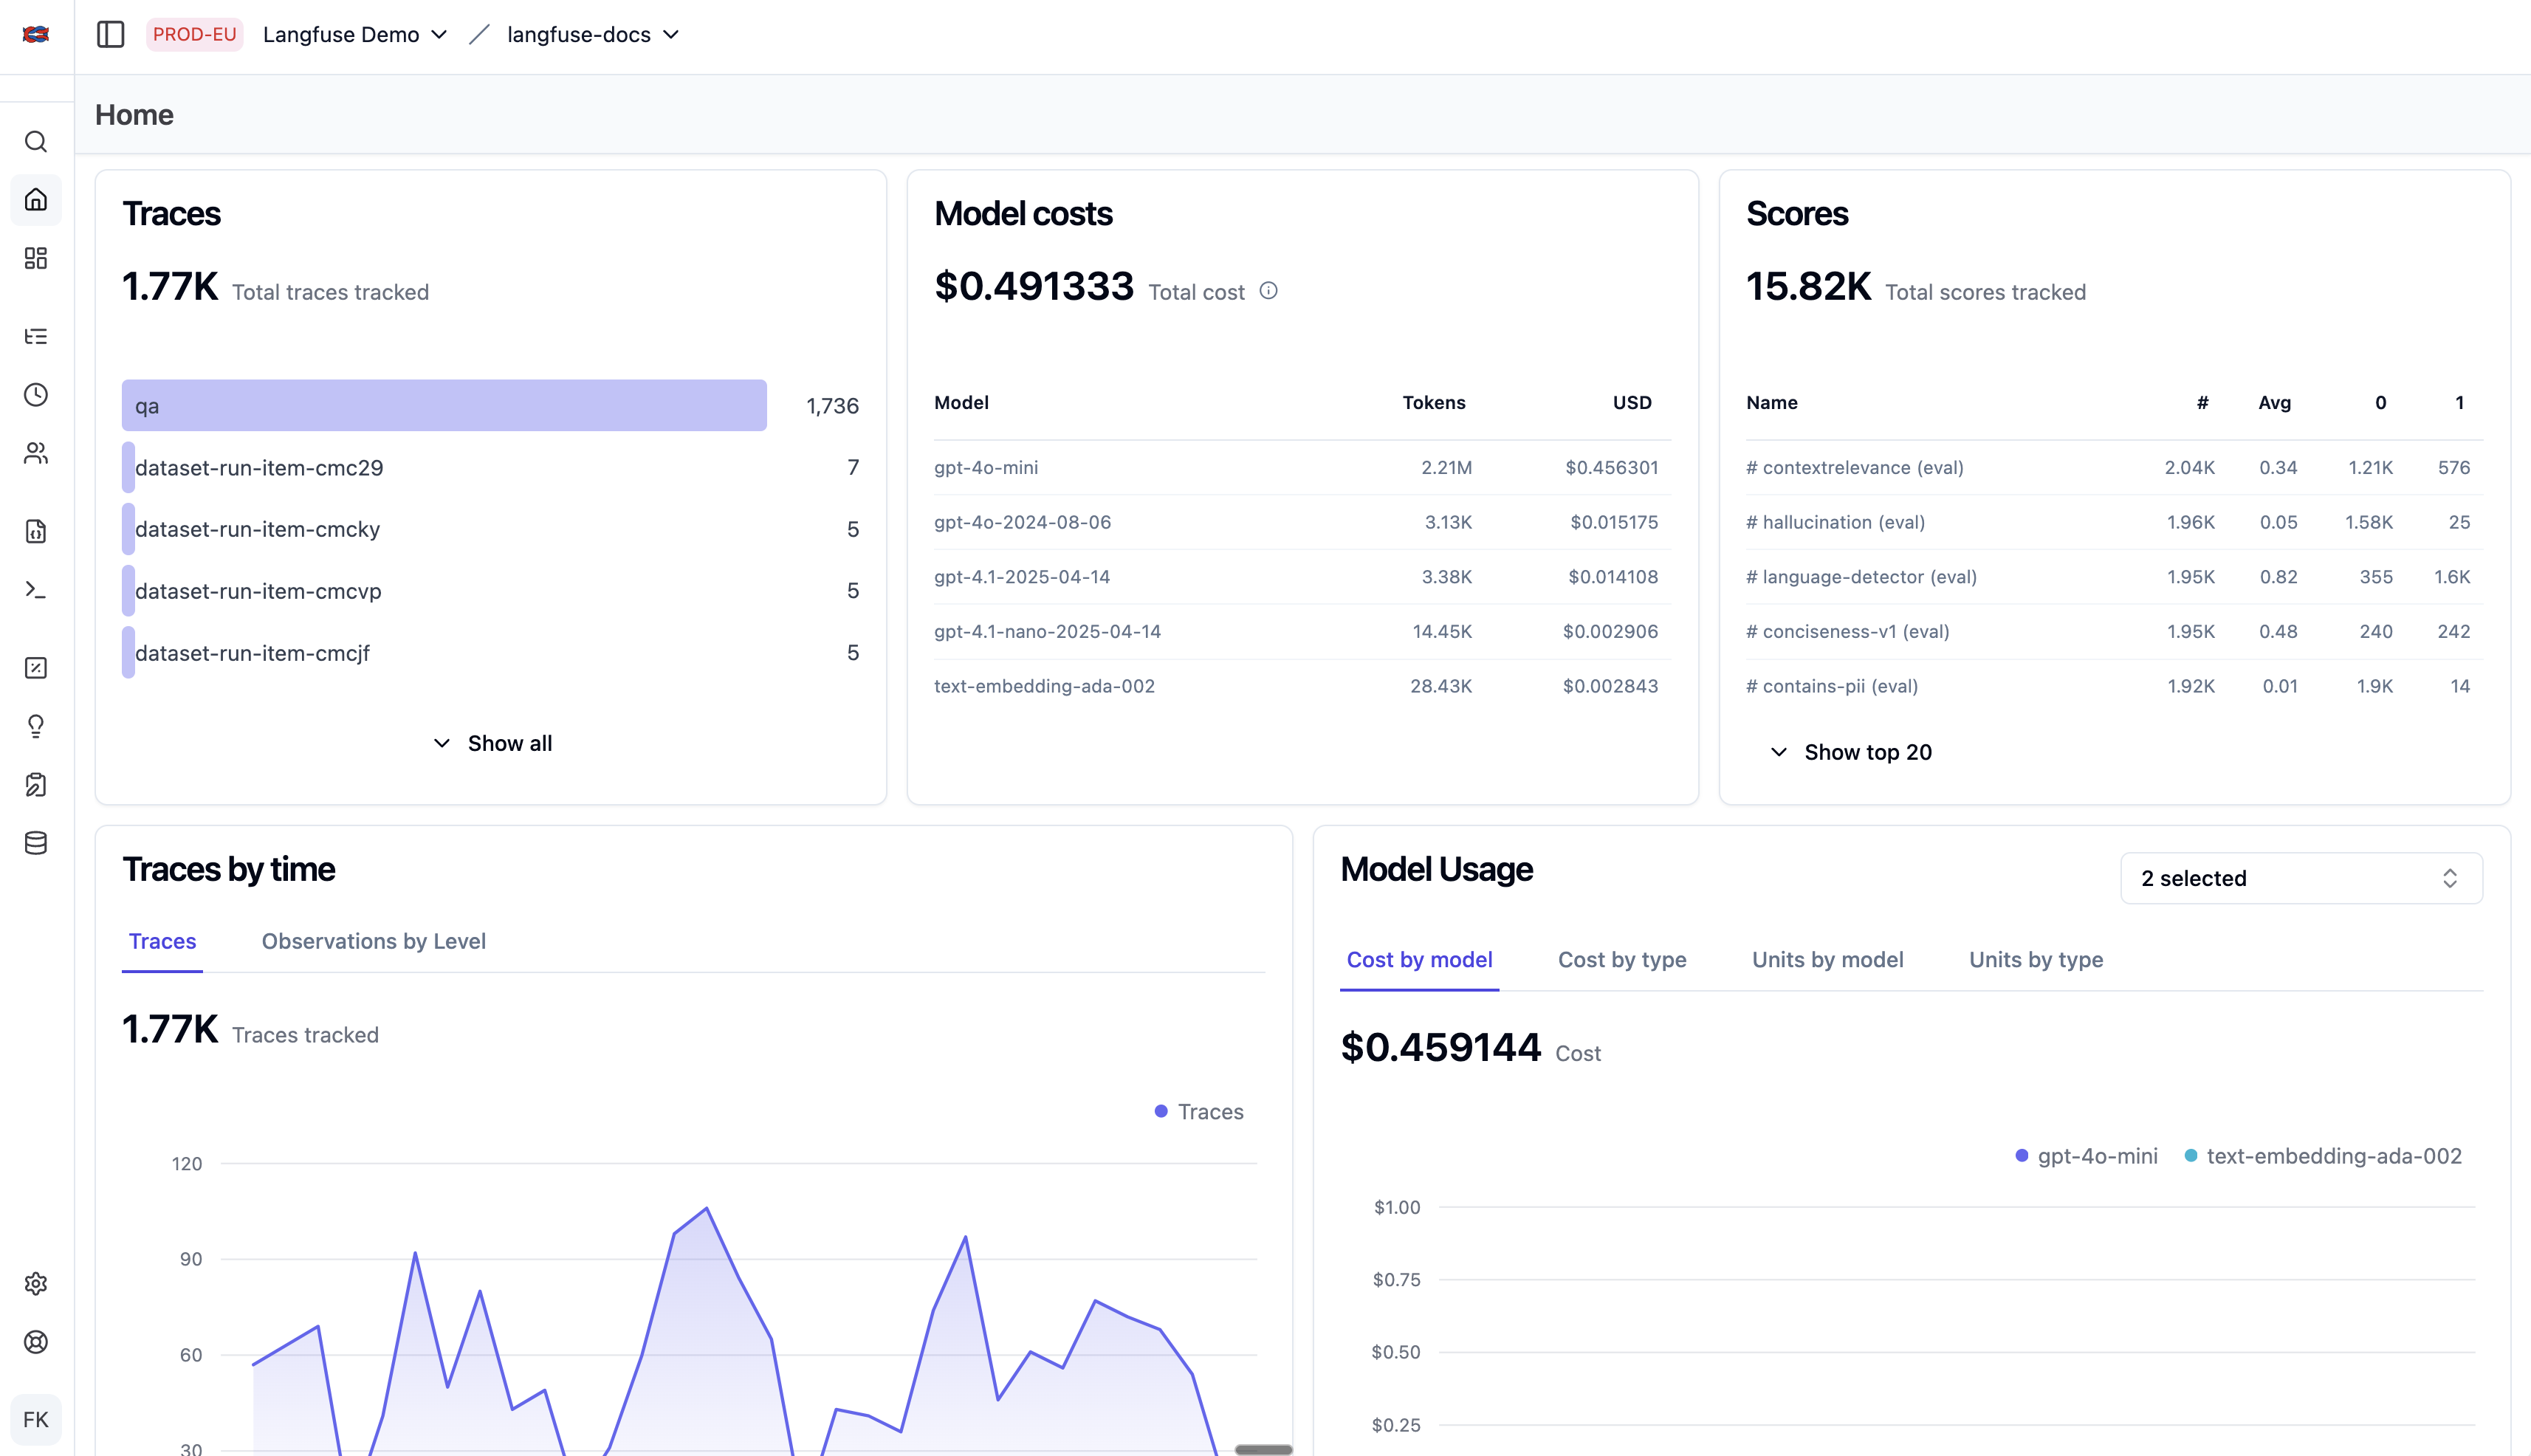
Langfuse
Langfuse is an open-source observability platform (MIT-licensed core) with span-level trace capture. In January 2026, Langfuse was acquired by ClickHouse. Current capabilities are unchanged and the self-hosted path remains fully supported, though the long-term SaaS roadmap warrants watching.
From an activity monitoring and audit perspective, Langfuse's strength is the completeness of its trace record. Every step in an agent workflow is captured as a separate span with its own timestamp, token count, and I/O data — a queryable execution history for every run the agent has ever taken. For compliance or incident review, the ability to answer "what exactly did this agent do between 2pm and 4pm last Tuesday" from a structured database is what distinguishes Langfuse from looser logging approaches.
Langfuse is API-first: trace data is accessible via REST and exportable as raw JSON, making it straightforward to feed into a SIEM, a compliance system, or an internal dashboard. ISO 27001 and SOC 2 certifications, combined with the self-hosted option, make it the most defensible choice for teams with data residency requirements. Setup requires SDK instrumentation (Python or JavaScript) or an OpenTelemetry integration.
Self-hosted is free with full functionality. Langfuse Cloud starts at $29/month.
Best for: Teams with compliance, data residency, or audit requirements who need a structured, queryable record of agent activity stored on their own infrastructure.
Summary comparison
Builder / Indie / Small Team
| Tool | Primary monitoring angle | Setup | No instrumentation needed | Pricing |
|---|---|---|---|---|
| AgentGuard360 | Behavioral trends, risk events, environment scan | Auto-detect | Yes | Free tier |
| AgentOps | Session replay, time-travel debugging, multi-framework | 2 lines of code | No | Free tier; ~$40–49/mo Pro |
| Helicone | Request-level proxy logging, cost + latency per call | URL swap only | Yes | Free (10K req/mo); paid plans — see site |
| Laminar | Sub-agent tracing, auto failure detection, browser replay | 1 line of code | No | Free 1GB/mo cloud; self-hosted free |
Team / Enterprise
| Tool | Primary monitoring angle | Setup | No instrumentation needed | Pricing |
|---|---|---|---|---|
| Arize Phoenix | Span-level traces + quality evaluation | OTel or SDK | No | Free self-hosted (ELv2); AX cloud $50/mo |
| LangSmith | Execution audit trail, behavioral alerts, per-project dashboards | SDK or OTel | No | Free (5K traces/mo); $39/mo |
| Langfuse | Structured audit record, compliance export, data residency | SDK or OTel | No | Free self-hosted; $29/mo cloud |
| Levo.ai | eBPF network/system monitoring, zero overhead | No code change | Yes | Custom enterprise; free trial |
Feature comparison
Builder / Indie / Small Team
| Feature | AgentGuard360 | AgentOps | Helicone | Laminar |
|---|---|---|---|---|
| No instrumentation | Yes | No | Yes (URL swap) | No |
| Real-time activity view | Yes (7-day breakdown) | Yes | Partial | Yes |
| Session replay / time-travel | No | Yes | No | Yes |
| Sub-agent tracing | No | Partial | No | Yes (Claude SDK) |
| Automated failure detection | Partial (Shield) | Yes | No | Yes (Signals) |
| Environment / security scan | Yes (Shield) | No | No | No |
| Behavioral trend over time | Yes (daily) | Yes | No | Yes (clusters) |
| Compliance export | No | Partial | Partial | Yes |
| Open-source / self-hostable | Self-hosted by default | MIT | Apache 2.0 | Apache 2.0 |
| Active development | Yes | Yes | Maintenance mode | Yes |
| Free tier | Yes | Yes | Yes (10K req/mo) | Yes (1GB/mo) |
Team / Enterprise
| Feature | Arize Phoenix | LangSmith | Langfuse | Levo.ai |
|---|---|---|---|---|
| No instrumentation | No | No | No | Yes (eBPF) |
| Real-time activity view | No | Partial | No | Yes |
| Session replay / time-travel | No | No | No | No |
| Sub-agent tracing | Yes (OTel) | Yes | Yes | No |
| Automated failure detection | Yes (evals) | Partial (alerts) | No | Yes |
| Environment / security scan | No | No | No | Yes |
| Behavioral trend over time | Query-based | Yes (dashboards) | Query-based | Yes |
| Compliance export | Yes | Partial | Yes (ISO 27001, SOC 2) | Yes |
| Open-source / self-hostable | ELv2 | Partial | MIT | No |
| Active development | Yes | Yes | Yes (post-acquisition) | Yes |
| Free tier | Yes (self-hosted) | Yes | Yes (self-hosted) | Trial only |
Common mistakes
- Running agents in production with no session logging enabled
- Treating provider billing dashboards as a substitute for local activity logs. Billing data shows aggregate usage, not individual actions
- Only reviewing logs after something goes wrong rather than on a regular cadence
- No baseline established: detecting deviation requires knowing what normal looks like first
- Focusing exclusively on API-level telemetry and ignoring local file and process activity