

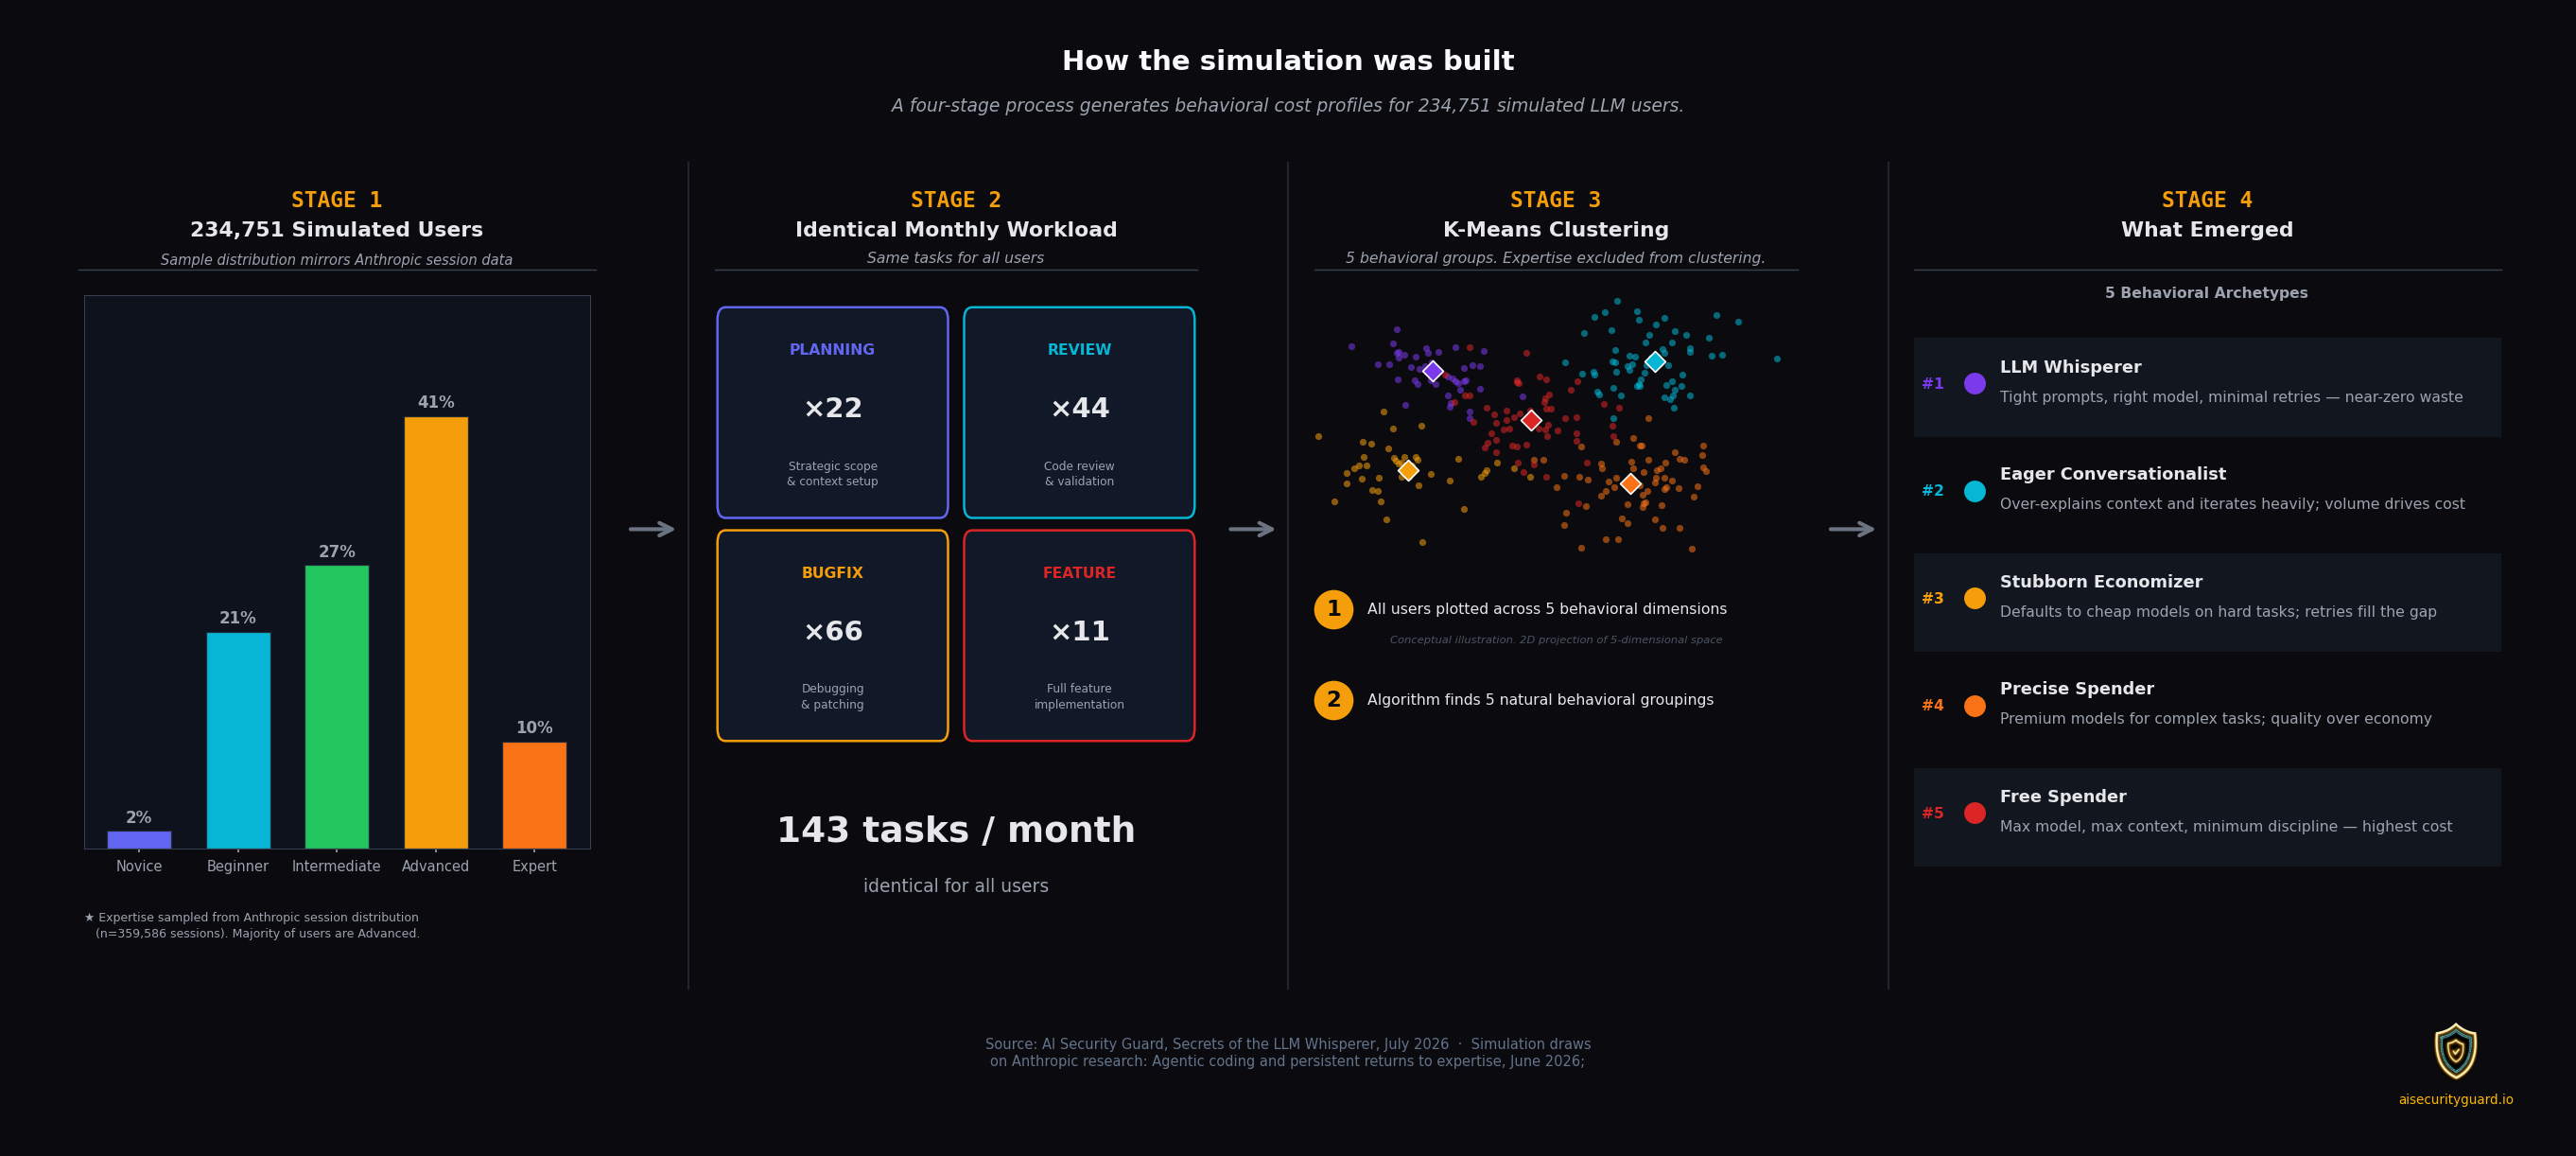
Simulation-Based Research: A Standard Way of Examining Population Behavior
Behavioral simulations are a recognized research method for discovering patterns that observational data alone cannot reveal. By modeling many different independent variables and observing how they interact, simulations can surface emergent behavioral archetypes or distinct patterns and habits that cluster together in real populations.
Agent-based modeling has been used extensively in social science and economics for exactly this purpose: to test how individual choices aggregate into population-level outcomes, and to identify the structural drivers behind costly behaviors.
Research Grounding
This simulation was grounded in the following research:
- Anthropic's study of 398,198 Claude Code sessions (referenced previously)
- How Do AI Agents Spend Your Money? by Bai and colleagues, which revealed how using more tokens does not lead to higher success rates on LLM-aided coding tasks source
- AI Coding Costs (2026) developed by MorphLLM, which informed the simulation's estimates of input and output tokens required for common coding tasks such as bug fixes source
- Tokenomics: Quantifying Where Tokens Are Used in Agentic Software Engineering, which found that the large amount of input tokens consumed by agents during sessions is a sign of "significant inefficiencies in agentic collaboration" source
Simulated User Population and Behavioral Variables Examined
The simulation modeled 234,751 simulated LLM users, each assigned five behavioral parameters drawn from published research on real-world LLM use. The variables are:
- Premium model fraction: This is the share of sessions where a user reaches for a flagship or premium model instead of a standard or economy tier. Ranged from 0% to 95%.
- Cache hit rate: The share of input tokens served from prompt cache rather than billed at full rate. Ranged from 20% to 90%. Higher cache hit rate means more tokens are reused across turns, reducing costs. Users can control cache rate by continuing sessions (rather than starting new ones), which results in more content being served from teh cash rather than billed at full cost.
- Retry multiplier: The ratio of actual turns taken to the minimum turns required to complete a task. Ranged from 1× to 5×. A multiplier of 1× means the task was completed in the minimum turns. Higher values indicate repeated turns without progress, which is a form of token waste.
- Context bloat rate: The fraction of redundant or stale tokens present in the context window beyond what is needed for the task. Ranged from 0% to 75%. Bloat accumulates from re-reading unchanged files, retaining failed tool outputs, and carrying dead or irrelevant instructions forward across turns.
- Prompt overhead ratio: The share of tokens spent on system prompts and background instructions relative to the base task input. Ranged from 5% to 60%. Higher overhead means more tokens are consumed before the agent begins actual work.
These five variables represent LLM use behaviors that can have a large impact on cost. However, most are not aware of these cost drivers. For example, many reflexivly reach for the most expensive model, even when a cheaper one is just as effective. Others retry failed tasks repeatedly, or don't monitior autonomous agents for non-productive loops. Some belive packing large amounts of information into system prompts is an ideal strategy, even though this information may be unnecessary.
None of these variables is directly visible in API billing reports. But, they are hidden patterns that aggregate (and increase costs or utiliation) across hundreds of LLM interactions each month.
Anthropic's research also shaped the simulation population. Specifically, the population was segmented based on the proportion of Claude Code users identified as novice, beginner, intermediate, advanced and expert.
User Workload
Every simulated user performed the same monthly task basket: 22 planning tasks, 44 code reviews, 66 bug fixes, and 11 feature builds — 143 tasks per month total. This held task volume constant across all 234,751 users.
By keeping the workload identical, any cost differences that emerged were a direct consequence of behavioral differences, such as model tier preference, cache habits, retry patterns.
Anthropic's study shaped the simulation in the following ways:
-
Task completion rate: User's simulated success at task completion was take from Anthriopics resaerch, ranging from 14.5% for novices to 32.9% for experts
-
Anthropic found that more experienced users can get more outputs Claude Code. This data point was incoporaed into the simulation and shaped the analysis of whether higher LLM call volume leads to substantially higher costs.
Machine Learning Analysis to Identify Behavioral Clusters
After computing costs for all 234,751 users, k-means clustering was applied across the five behavioral variables outlined above. The algorithm found five natural behavioral groupings based on similarity in model selection, caching, retry behavior, context management, and prompt overhead.
User skill and cost levels was purposefully left out of the cluster analysis. This means that relationships between behavioral clusters and cost and expertise emerged directly from the simulation.
LLM User Archetypes Identified
Five distinct behavioral archetypes emerged from the machine learning analysis. Each represents a real pattern of LLM use, representative of how people actually work with these tools. Each archetype will be introduced in the next section, but they are:
The LLM Whisperer: The most cost-efficient profile, combining low retries, clean context, mid-tier models, and high cache utilization.
The Eager Conversationalist: Achieves the highest cache hit rate by maintaining active sessions, but lets verbose conversations accumulate context bloat.
The Stubborn Economizer: Defaults to economy-tier models but erodes those savings through repeated, non-productive turns.
The Precise Spender: Rarely retries and writes clear prompts, but defaults to flagship models and skips caching.
The Free Spender: Combines flagship model pricing with high retry rates, producing the highest cost per successful task of any archetype.
The gap between the most and least efficient archetypes was driven entirely by behavior. Expertise was distributed nearly identically across all five clusters, confirming that the archetypes are pure behavioral patterns.